MarsCast: Weather Patterns from the Red Planet
Overview
Using data collected by the NASA Curiosity Rover between 2012 and 2018, we built an interactive dashboard to explore what six years of Martian weather data reveals about surface conditions on the Red Planet.
The Data
The dataset contains 1,895 weather observations collected directly from the surface of Mars, covering the period from Sol 1 (August 7, 2012 on Earth) to Sol 1895 (February 27, 2018 on Earth). Each observation includes information on the terrestrial date, number of martian days since Curiosity landed, solar longitude, martian month, minimum temperature, maximum temperature, and air pressure.
Performance and Storage
In order to improve app performance, we converted the source data from CSV to parquet and implemented lazy loading. In the context of the Shiny app, this meant that rather than loading the entire dataset into memory and then applying filters, the app was able to only actually load data matching the selected filters. Despite our relatively small dataset, we noticed that this sped up the dashboard’s ability to change displays with the filters. This change also lends itself to the app’s future scalability. If we expanded the scope of the dashboard to include data collected over a longer time period and by other Mars rovers, this change would make an even greater difference.
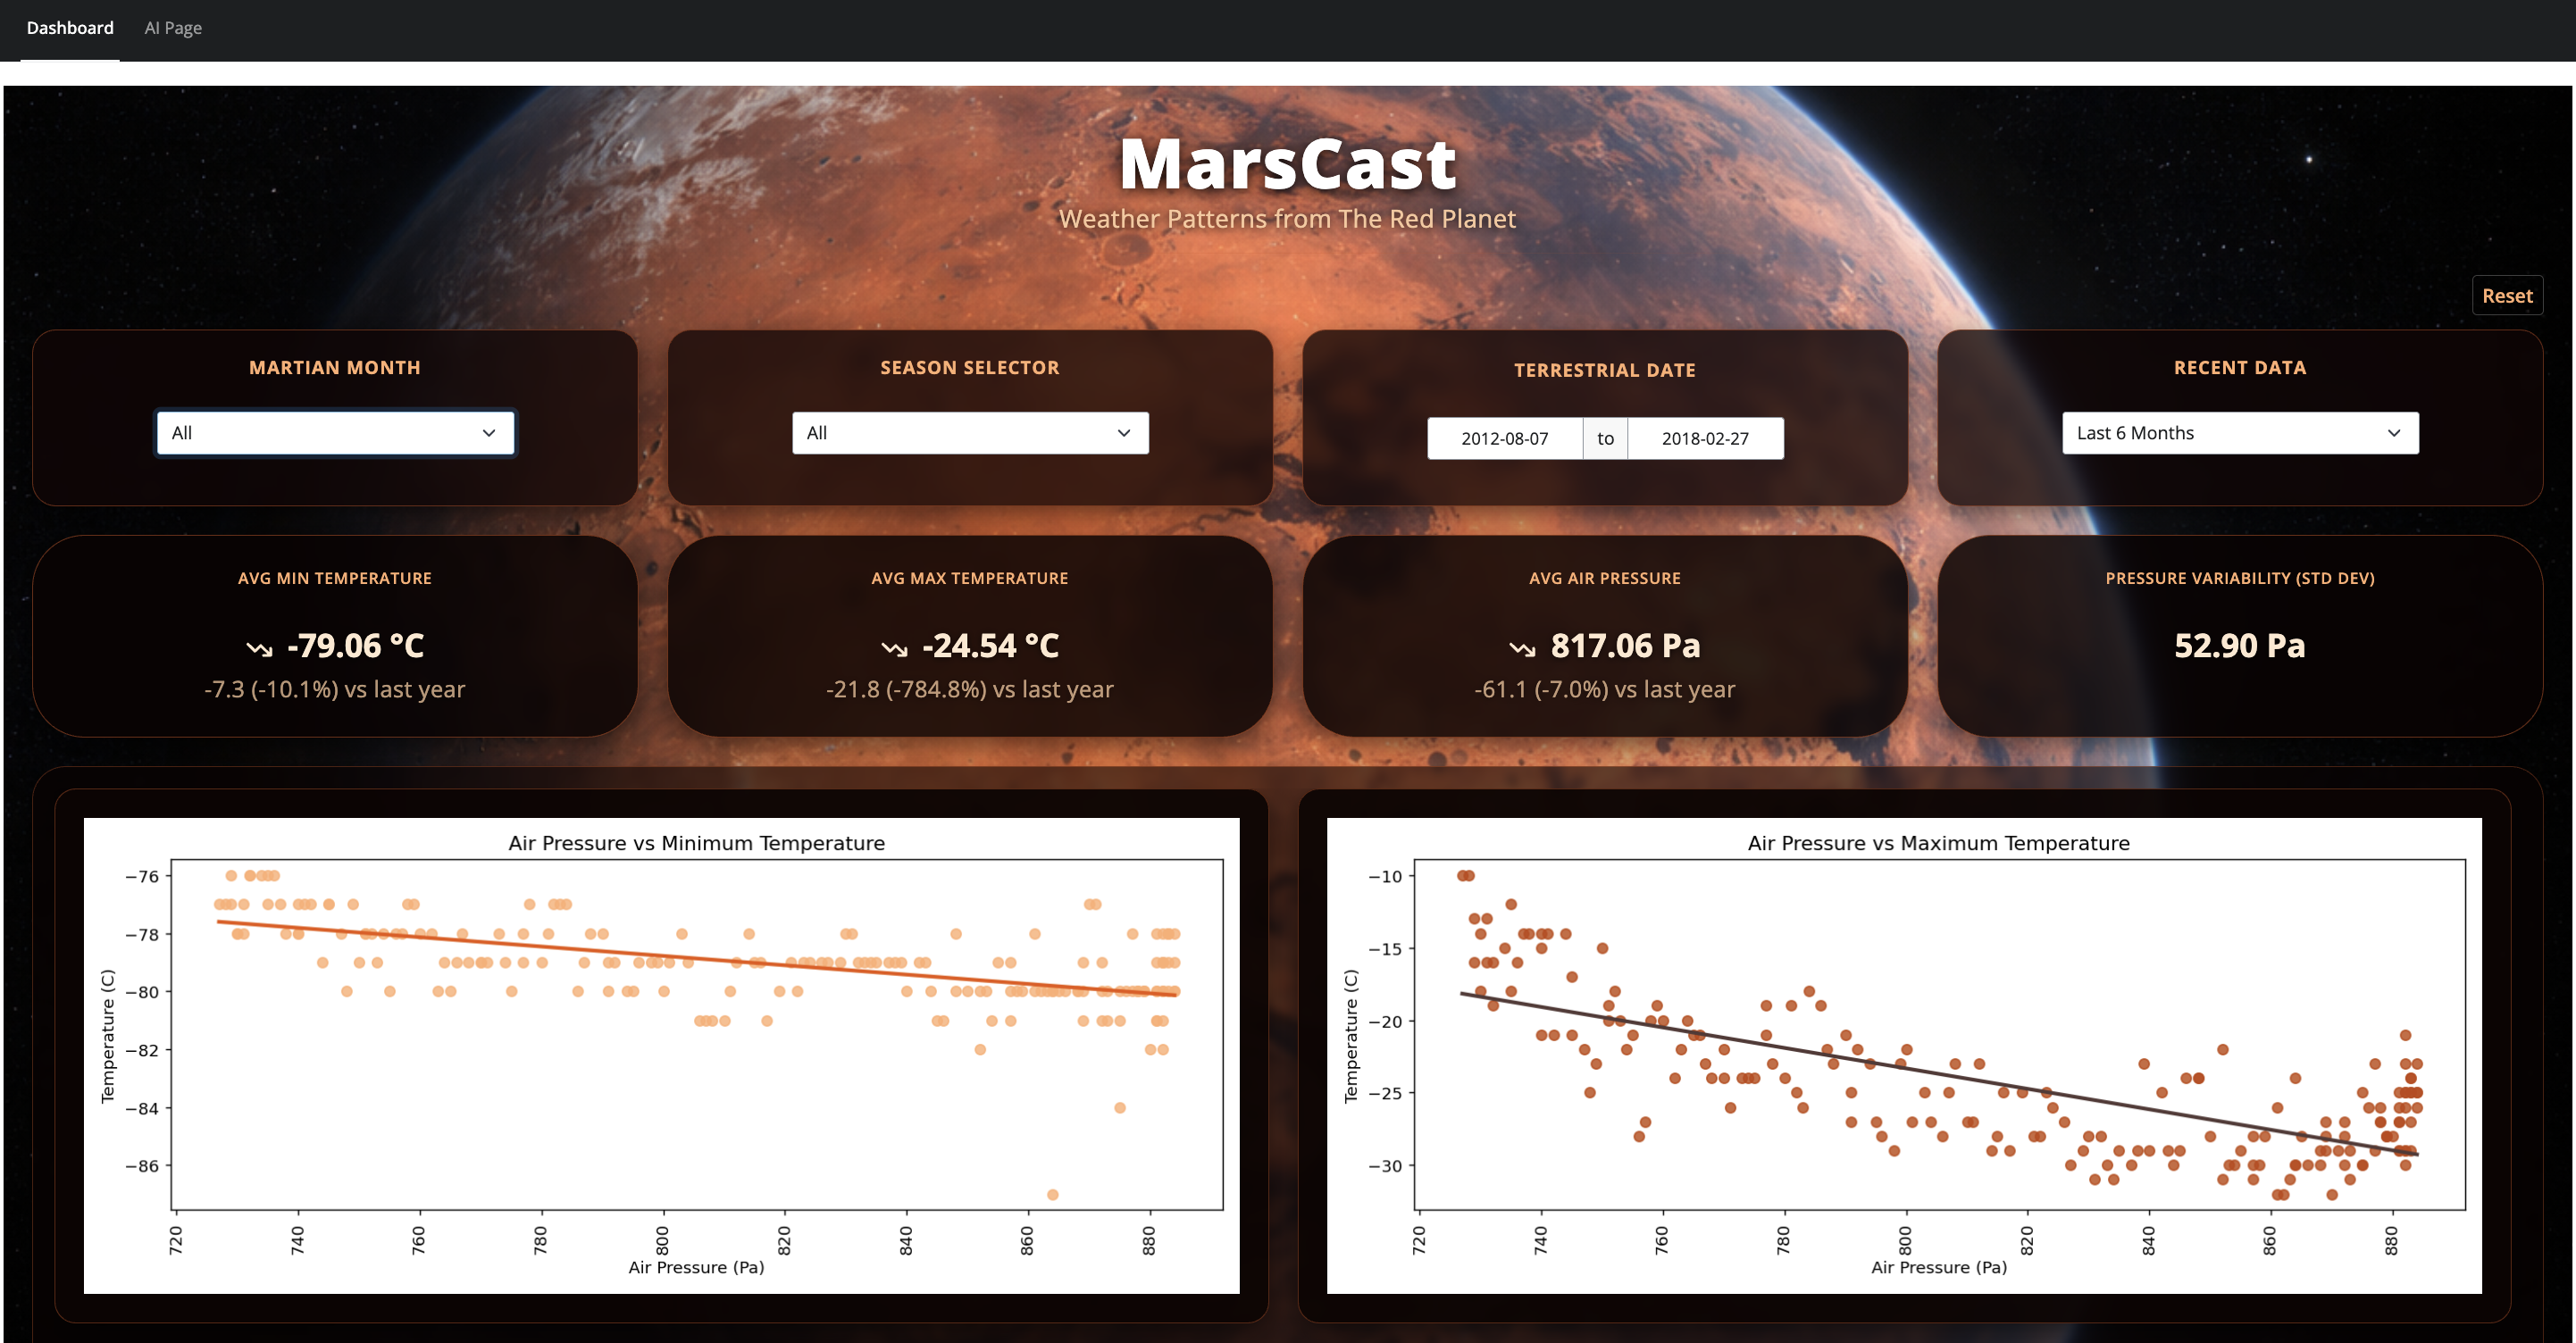
The Dashboard
The dashboard consists of two pages. The first page lets users filter the data by month and season to explore the relationships between temperature and air pressure as well as the changes in air pressure and temperature over time. The second page hosts the AI Chatbot.
The Chatbot
We built an AI-powered chatbot using shinychat and the Anthropic API, using Claude as the base model. To improve response quality on domain-specific questions, we implemented Retrieval Augmented Generation (RAG) with a custom document corpus covering the dataset variables, Gale Crater geology, and Curiosity’s mission context. A detailed system prompt controls the bot’s tone and scope, keeping responses focused the dashboard data rather than general trivia. The result is a chatbot that can answer specific questions about the dataset without hallucinating beyond what the data actually shows.
Testing
To further ensure reliability of our dashboard, we also implemented testing of both the filtering logic (using pytest) and of core UI functionality (using playwright).
Reflections
This project was challenging to implement in a team of 4. Since the bulk of work occurred in a single python script, we had to stagger work in order to avoid difficult merge conflicts and ensure continuity of code style. As the project progressed, we got better at splitting the work so that it could happen in parallel. My core contributions were converting the data pipeline to parquet and implementing lazy loading for performance, as well as ensuring the RAG pipeline integrated into the rest of our codebase without conflict.
Given more time to expand this project, I would like to use some time-series modelling techniques to better analyze the temperature and air pressure patterns. Additionally, it would be cool to use Shiny’s interactivity to build a page where you can choose different model parameters and see how the predictions change as a result.
Code: View on GitHub
Tools: Python · Shiny for Python · shinychat · Anthropic API · RAG · parquet · pandas
Collaborators: Eli Gonzalez, Zain Nofal and Sasha Sah